The Softwarised Network Data Zoo

The softwarised network data zoo (SNDZoo) is an open collection of software networking data sets aiming to streamline and ease machine learning research in the software networking domain. Most of the published data sets focus on, but are not limited to, the performance of virtualised network functions (VNFs). The data is collected using fully automated NFV benchmarking frameworks, such as tng-bench [1], [2] developed by us or third party solutions like Gym [4]. The collection of the presented data sets follows the general VNF benchmarking methodology described in [3].
All data sets are archived in their own GitHub repository using data version control (DVC) as technology to manage and version the contained table- and time series-based data blobs. If you are working in the network softwarisation domain, you are welcome to contribute your own data sets to this project.
Cite
To cite this work, e.g., if you use one of the contained data sets, please use:
@inproceedings{peuster2019sndzoo,
	Author = {M. Peuster and S. Schneider and H. Karl},
	Booktitle = {2019 IEEE/IFIP 15th International Conference on Network and Service Management (CNSM)},
	Month = {October},
	Publisher = {IEEE/IFIP},
	Title = {The Softwarised Network Data Zoo},
	Year = {2019}}
Note: This work is accepted for publication in 2019 IEEE/IFIP 15th International Conference on Network and Service Management (CNSM). A preprint is available on arXiv: official paper preprint.
Data
Overview of data sets available in the SNDZoo:
| Data set name | Class | SUT | Configs | Exp. metrics | TS metrics | Total data points | Data |
|---|---|---|---|---|---|---|---|
| SEC01 | IDS System | Suricata VNF | 1600 | 280 | 157 | 15.5M | Repo, ZIP |
| SEC02 | IDS System | Snort 2.9 VNF | 1600 | 280 | 169 | 16.7M | Repo, ZIP |
| SEC03 | IDS System | Snort 3.0 VNF | 800 | 281 | 593 | 28.7M | Repo, ZIP |
| WEB01 | Load balancer | Nginx VNF | 1600 | 268 | 43 | 4.6M | Repo, ZIP |
| WEB02 | Load balancer | HAProxy VNF | 1600 | 268 | 43 | 4.6M | Repo, ZIP |
| WEB03 | Proxy | Squid VNF | 1600 | 268 | 43 | 4.6M | Repo, ZIP |
| IOT01 | MQTT Broker | Mosquitto VNF | 1600 | 275 | 90 | 9.1M | Repo, ZIP |
| IOT02 | MQTT Broker | Emqx VNF | 1600 | 275 | 109 | 10.9M | Repo, ZIP |
Documentation
The following sections describe how to download and use the data sets. Further documentation can also be found in the wiki of SNDZoo’s “common” repository.
How to download the data sets?
Each data set is stored in its own GitHub repository from which the data files are linked using DVC. To download and use the data sets, you should use Git and DVC to ensure that you can always access the latest version of the data set. As a fallback, we also linked ZIP versions of each data set. However, the ZIP versions might be slightly outdated and not as well maintained as the Git/DVC versions are.
To get the data set (using SEC01 as example) do:
# 1. install DVC (see https://dvc.org/ for full instructions)
$ pip install dvc

# 2. clone data set git repository
$ git clone https://github.com/sndzoo/ds_nfv_sec01.git

# 3. switch folder
$ cd ds_nfv_sec01

# 4. pull the data files
$ dvc pull
DVC will start to download the data files belonging to the data set. This process might take some minutes (depending on your Internet connection):
Preparing to download data from 'https://sndzoo.s3.amazonaws.com/ds_nfv_sec01'
Preparing to collect status from https://sndzoo.s3.amazonaws.com/ds_nfv_sec01
[##############################] 100% Collecting information
[##############################] 100% Analysing status.
(1/4): [##############################] 100% data/csv_experiments.csv
(2/4): [##############################] 100% data/raw_records.tar.gz
(3/4): [##############################] 100% data/csv_timeseries.tar.gz
(4/4): [##############################] 100% data/raw_prometheus_data.tar.gz
[##############################] 100% Checkout finished!
Structure of the data sets
All data sets follow a similar file/folder structure (using SEC01 as example):
$ tree -h ds_nfv_sec01
├── [ 20K]  LICENSE
├── [2.0K]  README.md
├── [ 352]  data
│   ├── [3.1M]  csv_experiments.csv
│   ├── [ 173]  csv_experiments.csv.dvc
│   ├── [141M]  csv_timeseries.tar.gz
│   ├── [ 175]  csv_timeseries.tar.gz.dvc
│   ├── [421M]  raw_prometheus_data.tar.gz
│   ├── [ 180]  raw_prometheus_data.tar.gz.dvc
│   ├── [ 63M]  raw_records.tar.gz
│   └── [ 172]  raw_records.tar.gz.dvc
└── [ 224]  meta
    ├── [2.9K]  ped.yml
    ├── [108K]  platform_hw_info.xml
    ├── [ 298]  platform_sw_info_os.txt
    ├── [113K]  platform_sw_info_pkg.txt
    └── [ 14K]  ts_metrics.yml
meta/Folder containing configurations and further information about the data collection process and platform.ped.ymlExperiment description file (for experiments executed with tng-bench).platform_hw_info.xmlHardware information of the node(s) on which the experiment was executed and the data was collected.platform_sw_info_os.txtSoftware information (OS) of the node(s) on which the experiment was executed and the data was collected.platform_sw_info_pkg.txtSoftware information (installed packages and versions) of the node(s) on which the experiment was executed and the data was collected.-
ts_metrics.ymlList of time series metrics that are available incsv_timeseries.tar.gz. data/Folder containing the actual measurement data.*.dvcReference file used by DVC. Not of interest for the user.csv_experiments.csvTable that contains the experiment metrics and configurations. Each column contains one experiment parameter or metric. Each row represents one execution of the experiment and contains the measured data. Default CSV file format that can be imported with, e.g., Pandas.csv_timeseries.tar.gzArchive containing the time series data collect during each experiment in CSV format. Each file contains one time series metric for one experiment execution. Each row contains one data record. The archive can contain hundreds of thousands of small CSV files.raw_prometheus_data.tar.gzRAW Prometheus data recorded during experiment. Thecsv_timeseries.tar.gzdata is exported from this raw data (for reference, only for advanced users).-
raw_records.tar.gzRaw outputs and measurements produced by tng-bench. Thecsv_experiments.csvfile is exported from this raw data (for reference, only for advanced users). experiments/Folder that contains additional files to rerun the measurements that lead to this data set. Its contents depend on the used toolchain.
Where to start?
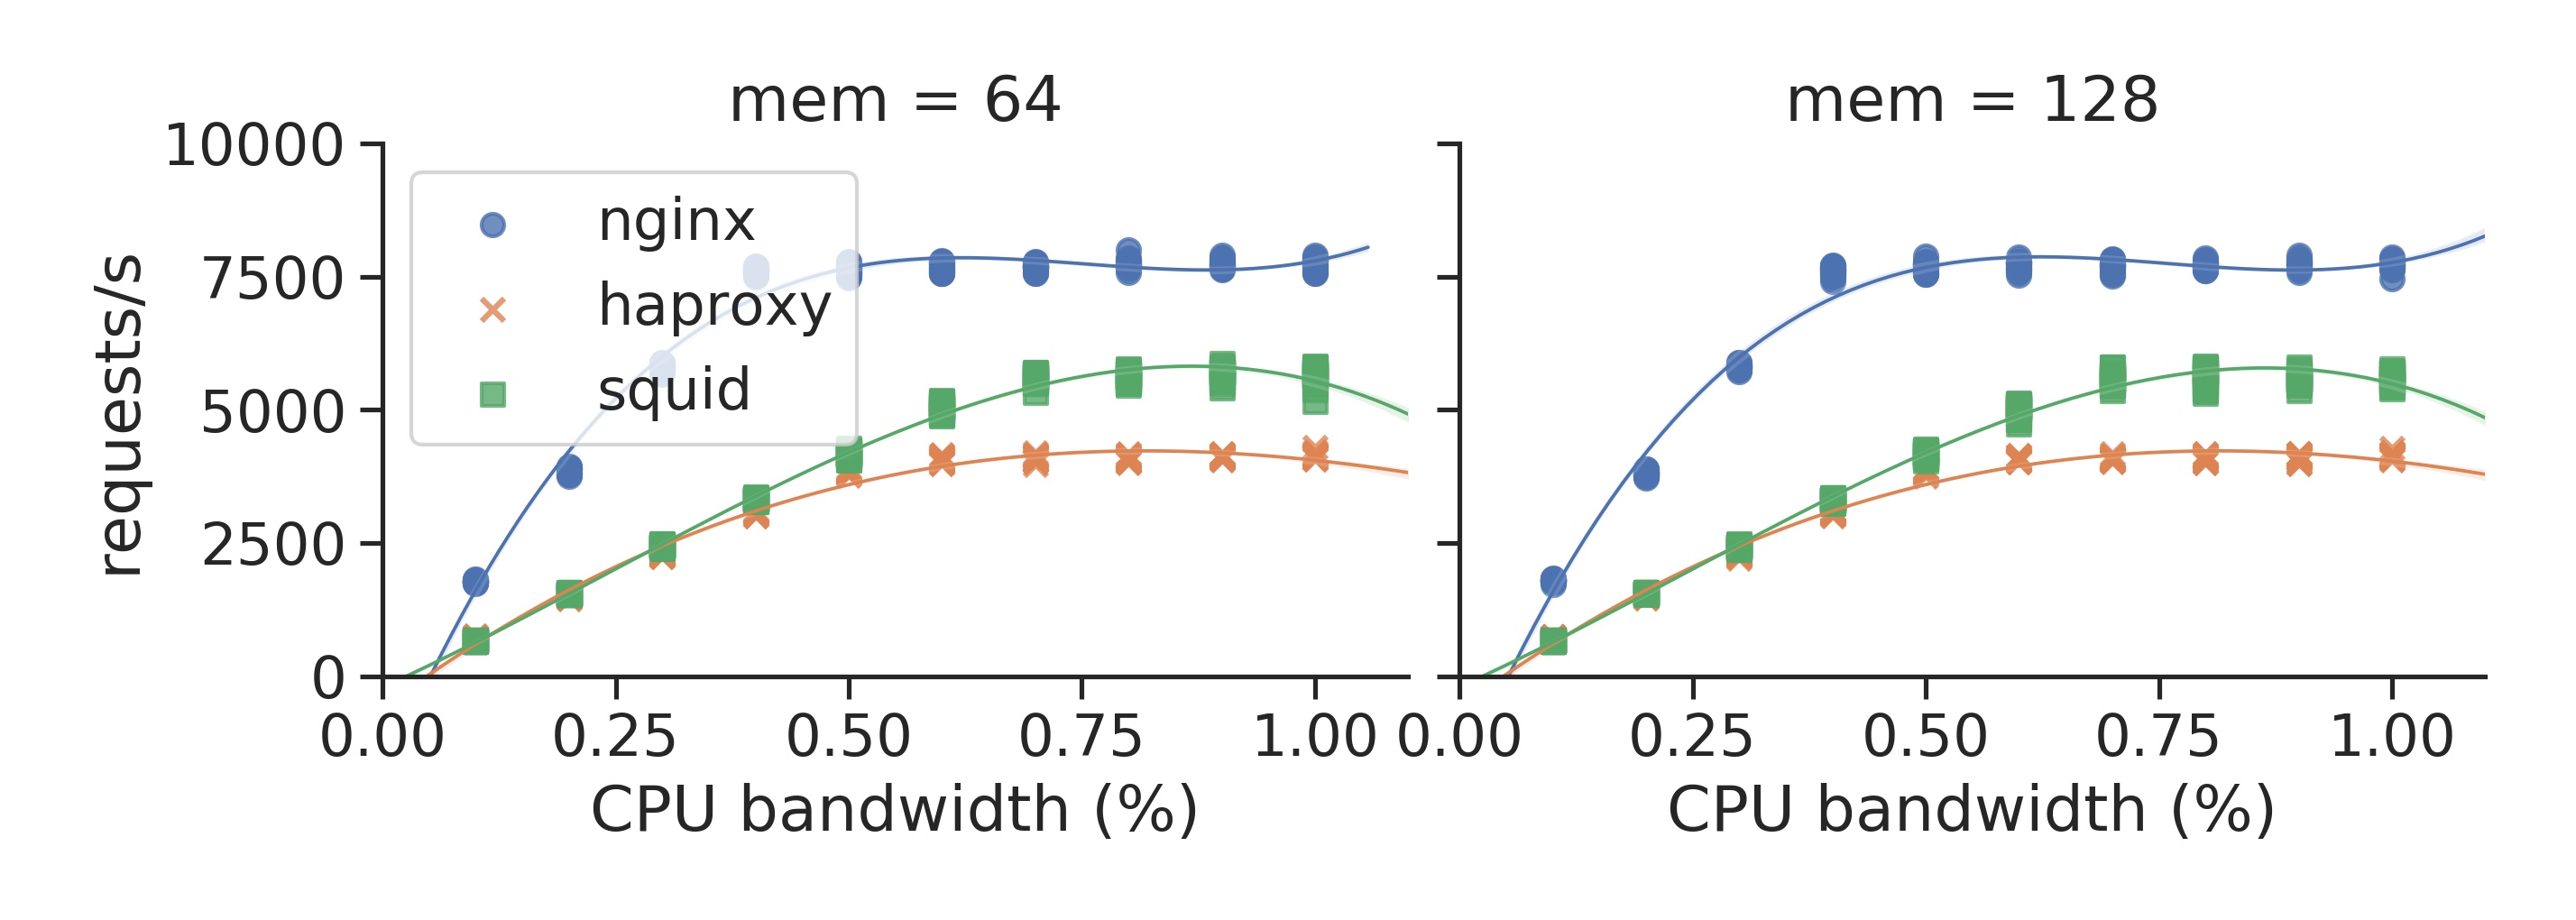
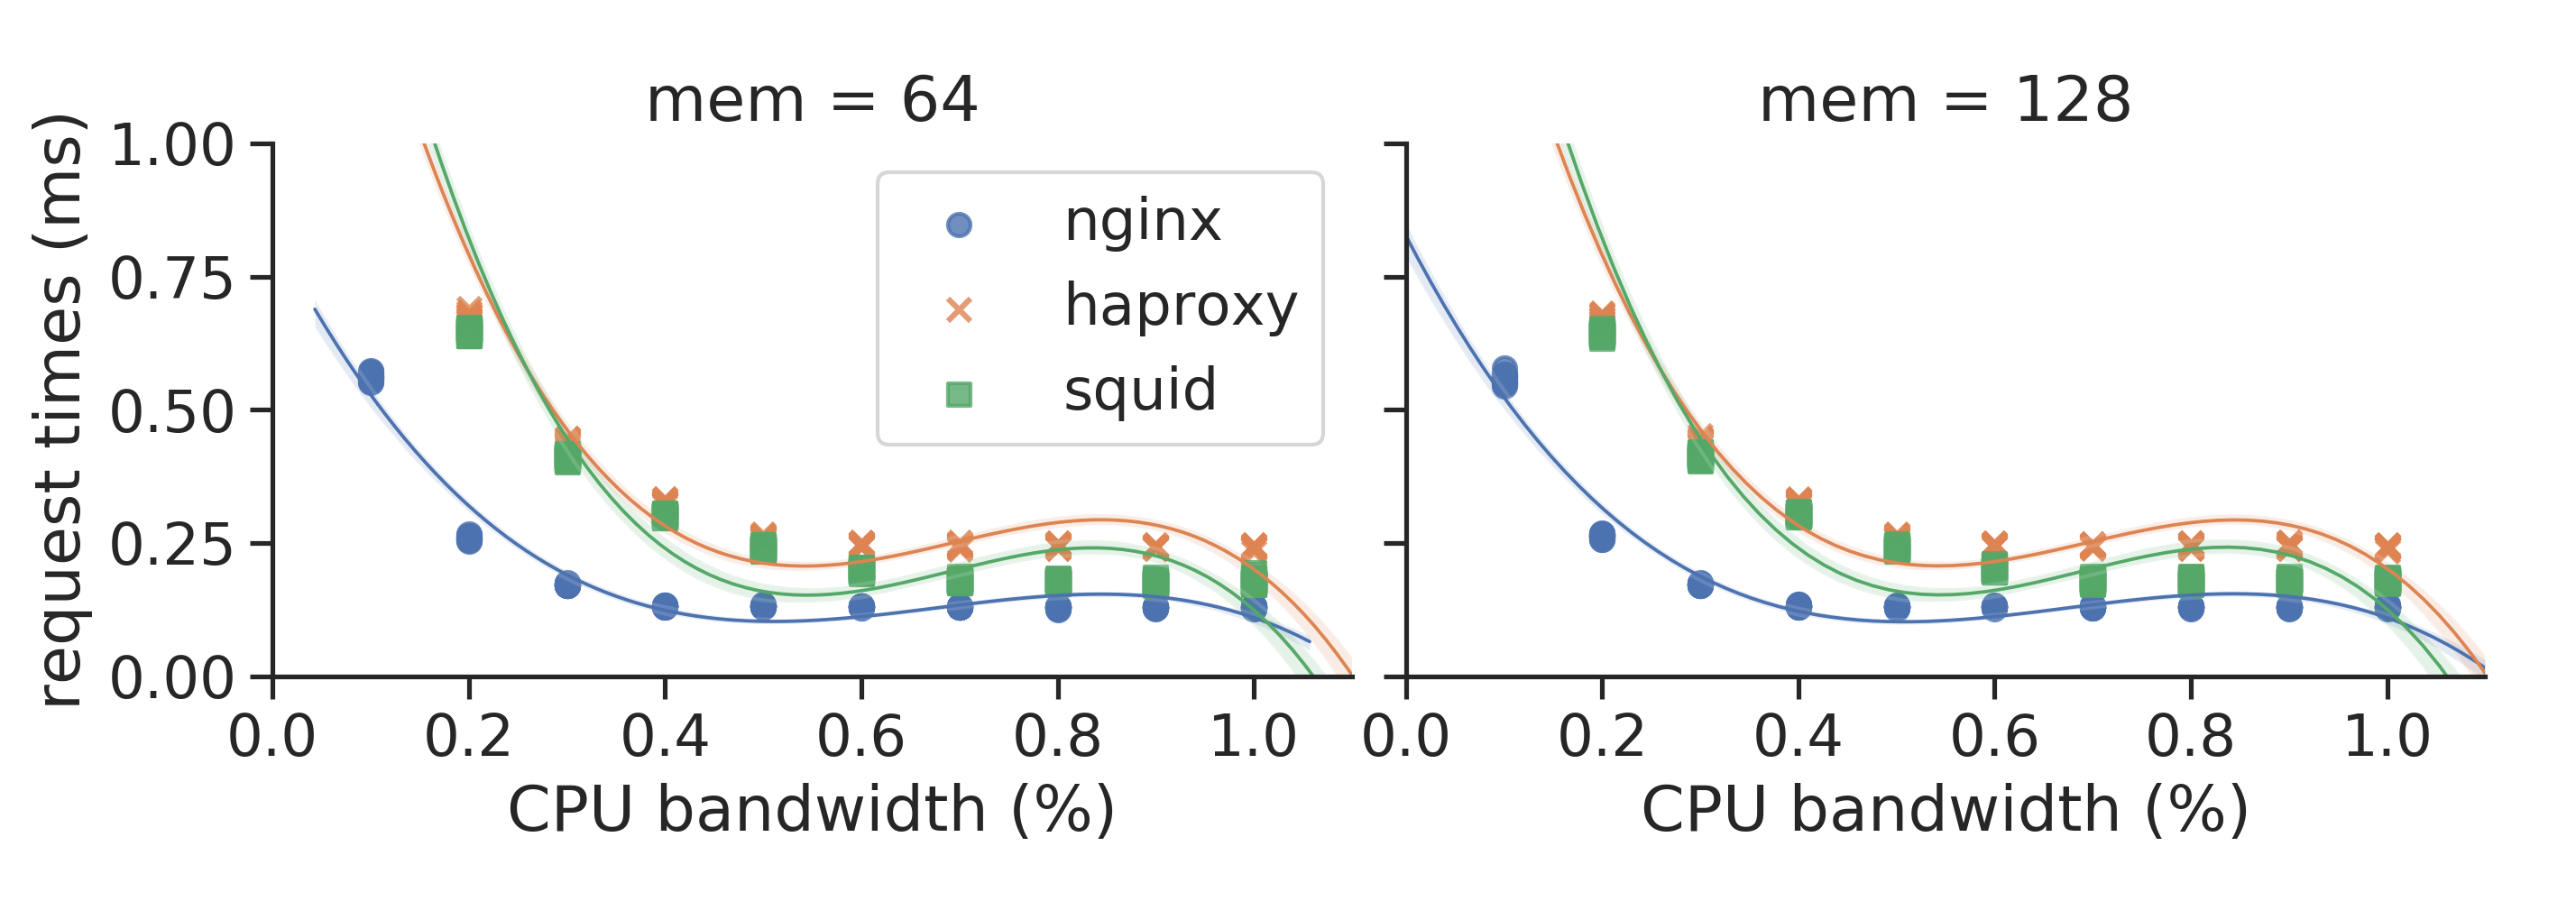
The most interesting file for most use cases is csv_experiments.csv which contains one row of measurement data for each experiment configuration that was executed and tested. The data can be easily loaded and plotted, as we show with some examples available in the analysis repository.
Example figures
How to reproduce the experiments?
You can reproduce all experiments that are designed to be executed with our NFV benchmarking automation framework tng-bench using two separated Linux machines. First, you need to install the tng-bench platform together with vim-emu and configure your testbed as described in this guide.
Once your testbed is installed you can clone SNDZoo’s common repository and pull the used VNFs (this should be done on both machines of the testbed):
# 1. clone SNDZoo common
$ git clone https://github.com/sndzoo/common.git

# 2. pull VNF images
$ cd common/vnfs/
$ ./pull.sh
Next, you need to clone the repository of the data set you want to replicate. In this example we use ds_nfv_sec01 (this is only needed on the machine on which you installed tng-bench). In the repository, you find all configurations needed to rerun the experiment using tng-bench:
# 1. clone data set repository with experiment definitions
$ git clone https://github.com/sndzoo/ds_nfv_sec01.git

# 2. run the experiment using tng-bench
$ cd ds_nfv_sec01/experiments
$ tng-bench -p peds/zoo_sec01.yml
Further documentation on how to run benchmarking experiments using tng-bench can be found in the documentation wiki.
After the experiment was executed, the results are available in results/. If you need help, please contact us:
Contribute
If you work on experimental evaluations of NFV, SDN or other softwarised network scenarios and want to share your data set, please contact us. We do not require the use of tng-bench to collect the data sets. Contributors are free to choose how they collect their data sets as long as they ensure that the data sets come with enough information such that the measurements can be reproduced in a fully automated fashion.
References
-
[1] M. Peuster and H. Karl: Profile Your Chains, Not Functions: Automated Network Service Profiling in DevOps Environments. IEEE Conference on Network Function Virtualization and Software Defined Networks (NFV-SDN), Berlin, Germany. (2017)
-
[2] M. Peuster, H. Karl, and S. v. Rossem: MeDICINE: Rapid Prototyping of Production-Ready Network Services in Multi-PoP Environments. IEEE Conference on Network Function Virtualization and Software Defined Networks (NFV-SDN), Palo Alto, CA, USA, pp. 148-153. doi: 10.1109/NFV-SDN.2016.7919490. (2016)
-
[3] R. Rosa, C. Rothenberg, M. Peuster, H.Karl: Methodology for VNF Benchmarking Automation. IETF draft BMWG (ongoing work) (2018)
-
[4] R. Rosa, C. Bertoldo, and C. E. Rothenberg. Take your vnf to the gym: A testing framework for automated nfv performance benchmarking. IEEE Communications Magazine 55.9 (2017): 110-117.
Contact
Manuel Peuster
Computer Networks Group
Paderborn University, Germany
Twitter: @ManuelPeuster
Mail: manuel (at) peuster (dot) de
Acknowledgments
This work has received funding from the European Union’s Horizon 2020 research and innovation program under grant agreement No. H2020-ICT-2016-2 761493 (5GTANGO), and the German Research Foundation (DFG) within the Collaborative Research Centre “On-The-Fly Computing” (SFB 901).
License
(c) 2019 by Manuel Peuster (Paderborn University)

This work is licensed under a Creative Commons Attribution-ShareAlike 4.0 International License.


